Ads

About Data2Slide
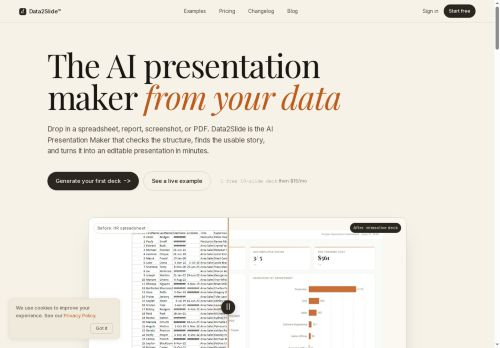
Data2Slide is an AI presentation maker that converts CSVs, Excel files, PDFs, screenshots, and text briefs into editable slide decks.It parses files in-browser, checks data readiness (metrics, dates, missing values, sensitive columns) and detects chartable KPIs for automated slide generation.
The tool builds structured presentations with charts, tables, timelines, hierarchical summaries, and one-line takeaways tailored to the described audience.It flags data issues and suggests fixes for sparse or wide tables before generation.
Output options include a downloadable self-contained HTML file, PowerPoint and Google Slides export, and a live shareable URL.Workflows support recurring reporting and quick deck iteration for sales teams, finance, HR, data scientists, analysts, and founders.
Key Features
Use Cases
Who is it for?
The tool builds structured presentations with charts, tables, timelines, hierarchical summaries, and one-line takeaways tailored to the described audience.It flags data issues and suggests fixes for sparse or wide tables before generation.
Output options include a downloadable self-contained HTML file, PowerPoint and Google Slides export, and a live shareable URL.Workflows support recurring reporting and quick deck iteration for sales teams, finance, HR, data scientists, analysts, and founders.
Key Features
- Converts CSVs, Excel files, PDFs, screenshots, and text briefs into editable slide decks
- Parses files in-browser
- Checks data readiness (metrics, dates, missing values, sensitive columns), flags data issues, suggests fixes, and detects chartable KPIs for automated slide generation
- Builds structured presentations with charts, tables, timelines, hierarchical summaries, and one-line takeaways tailored to the described audience
- Exports to downloadable self-contained HTML, PowerPoint, Google Slides, and provides a live shareable URL
Use Cases
- Convert monthly sales CSVs into polished, editable slide decks using data2slide, automatically detecting chartable KPIs, generating charts, tables and one-line takeaways, flagging data issues and exporting to PowerPoint or Google Slides for executive meetings
- Automate recurring performance reporting by parsing Excel and PDF source files in-browser, validating data readiness, creating updated charts, timelines and concise summaries, and exporting HTML or Google Slides for stakeholder distribution
- Transform research screenshots, text briefs or mixed-format data into data-driven presentations by extracting KPIs, building visuals and tables, surfacing data quality issues and producing editable decks for marketing, product or client proposals
Who is it for?
- Data scientists
- Founders
- Sales teams
- Finance teams
- Hr teams
No review yet!
More Presentations AI Tools
Explore other presentations tools with user ratings, pricing details, and in-depth descriptions. Updated regularly by our editorial team.